Network Topology
Interactive maps, host-group view, problem overlay, weathermap and geo — for your entire Zabbix frontend.
A frontend module that renders hosts, problems, traffic and root cause as a map — right inside Zabbix, no extra server. Force graph, wallboard, table and geo from the same data.
$ git clone https://github.com/linuser/zabbix-network-topology.git network_topology_v6
Cloning into 'network_topology_v6'... done.
$ sudo systemctl reload php8.3-fpm
✓ Module detected — enable under Administration → Modules
Switch views without leaving the map — same data, whatever the situation. Everything renders in the Zabbix frontend.
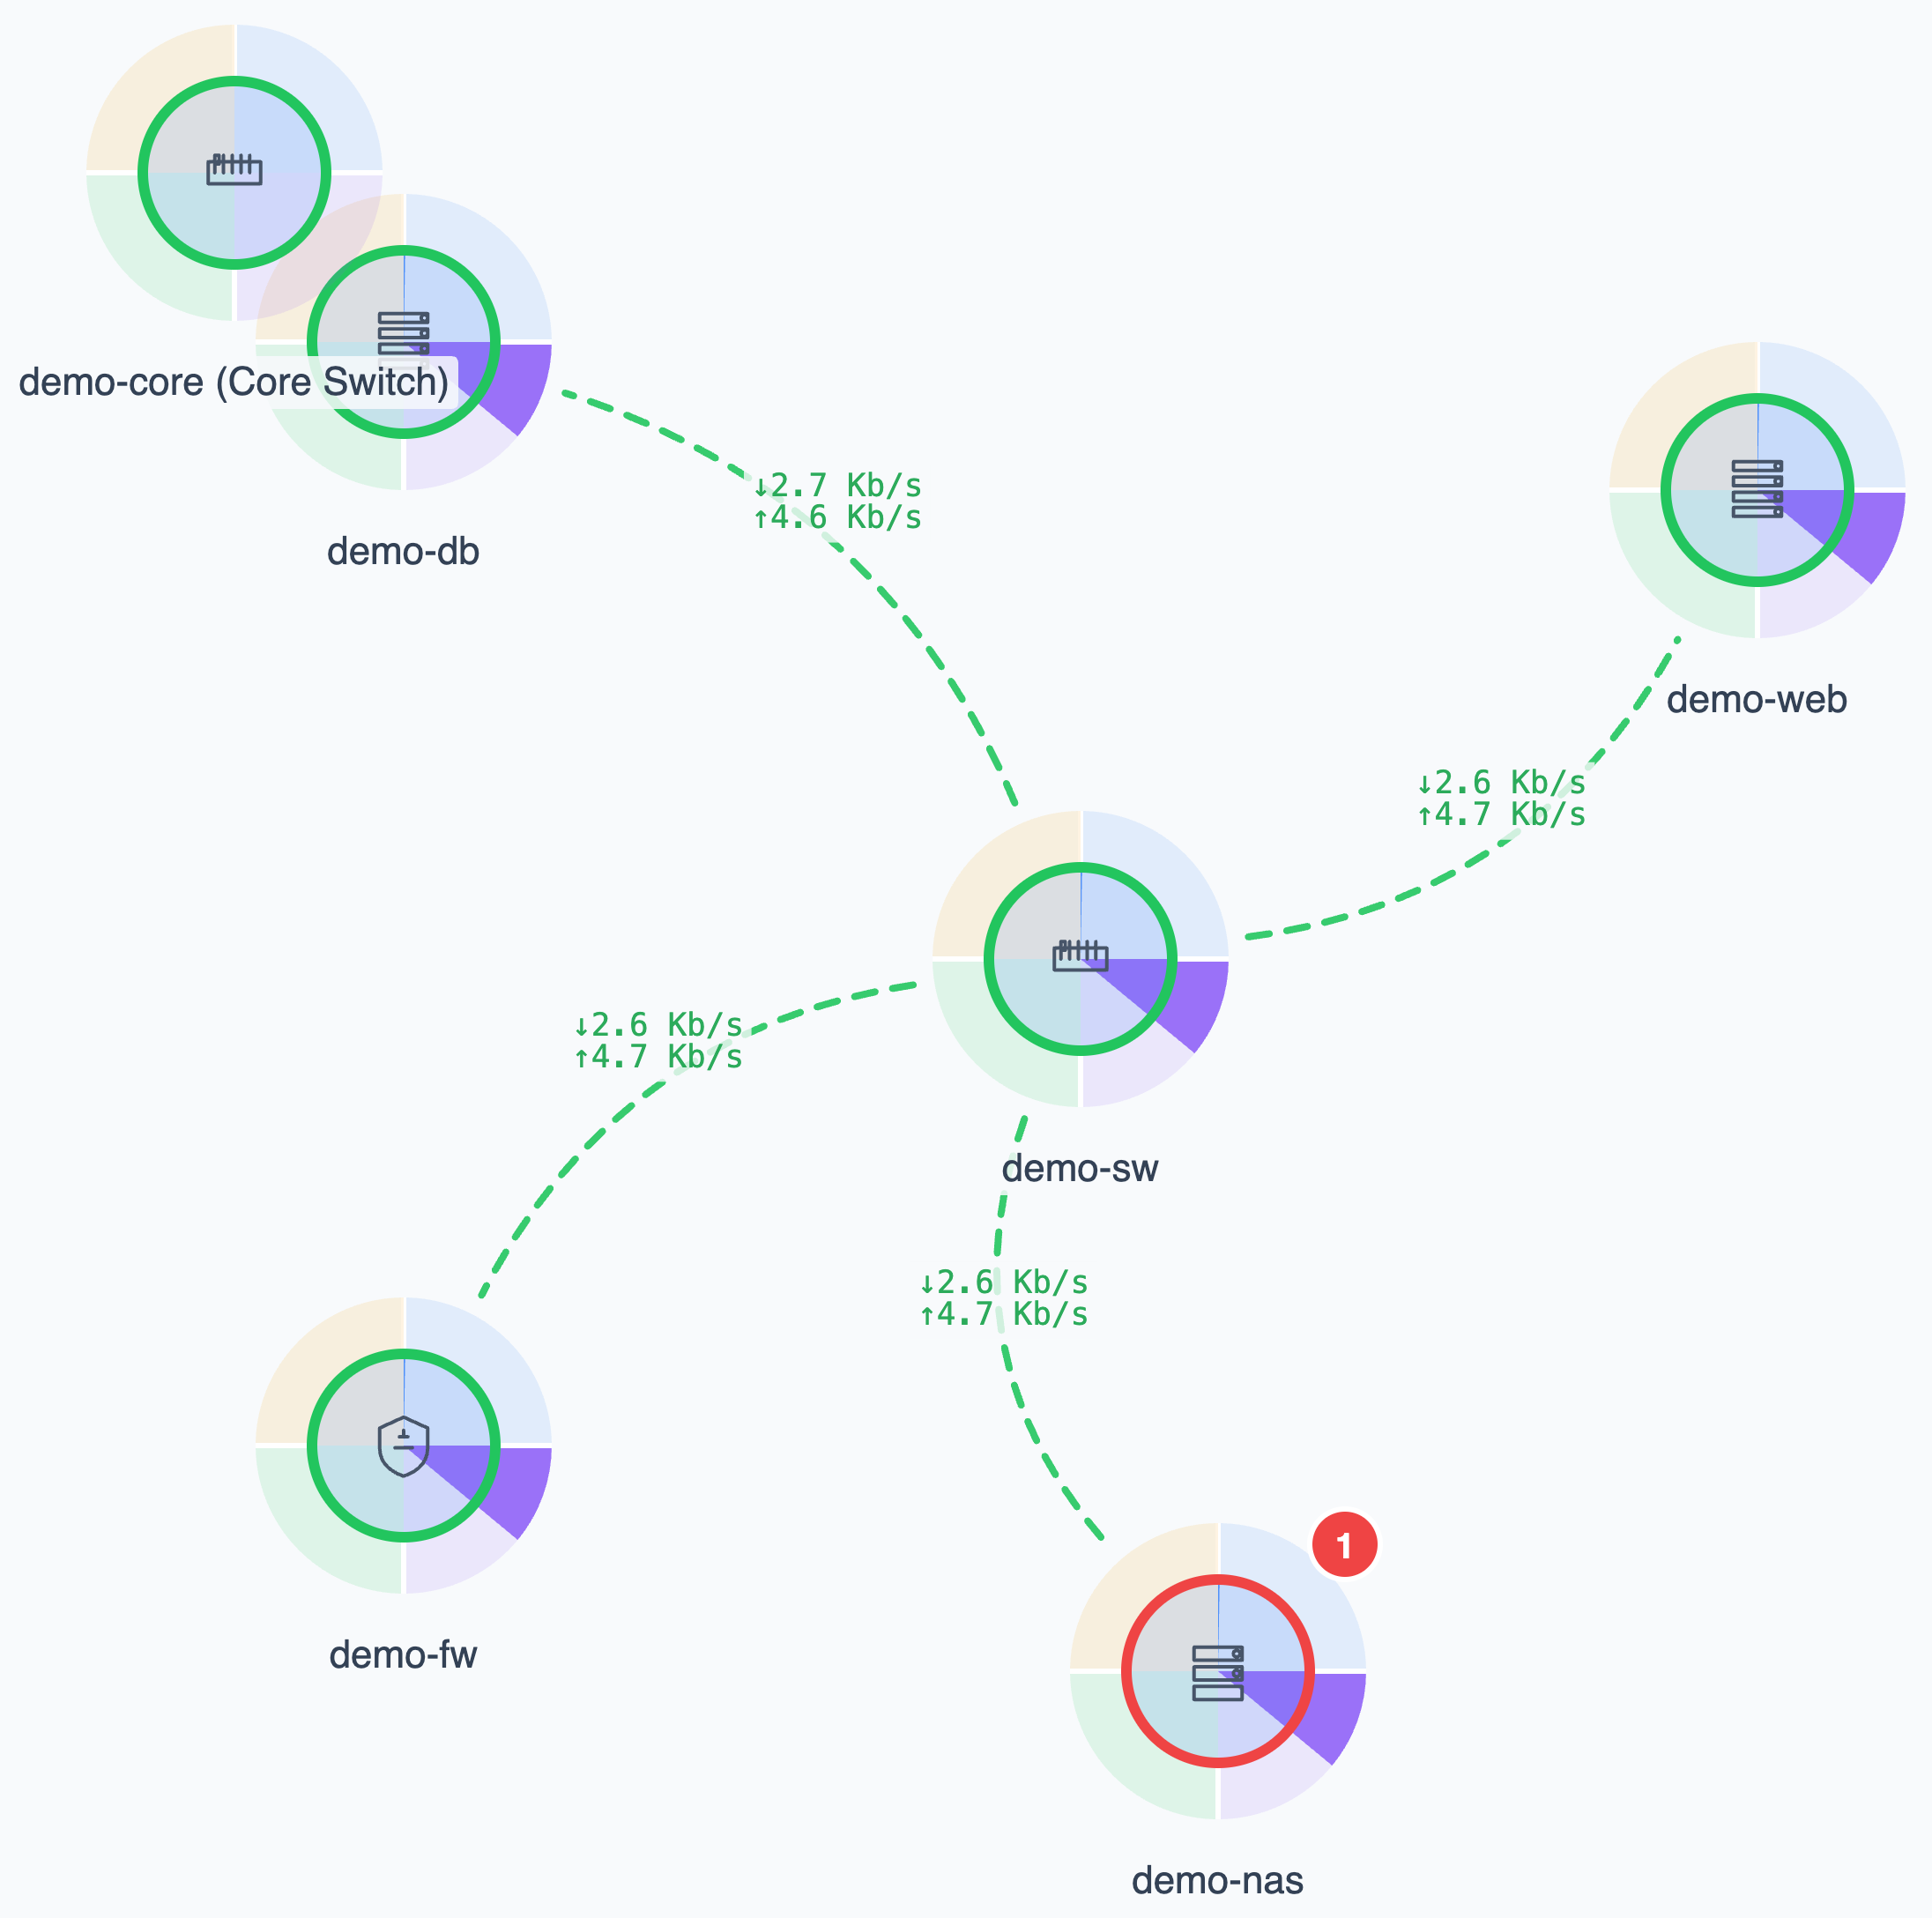
Force graph with severity rings and metric segments. LLDP/CDP discovers the links.
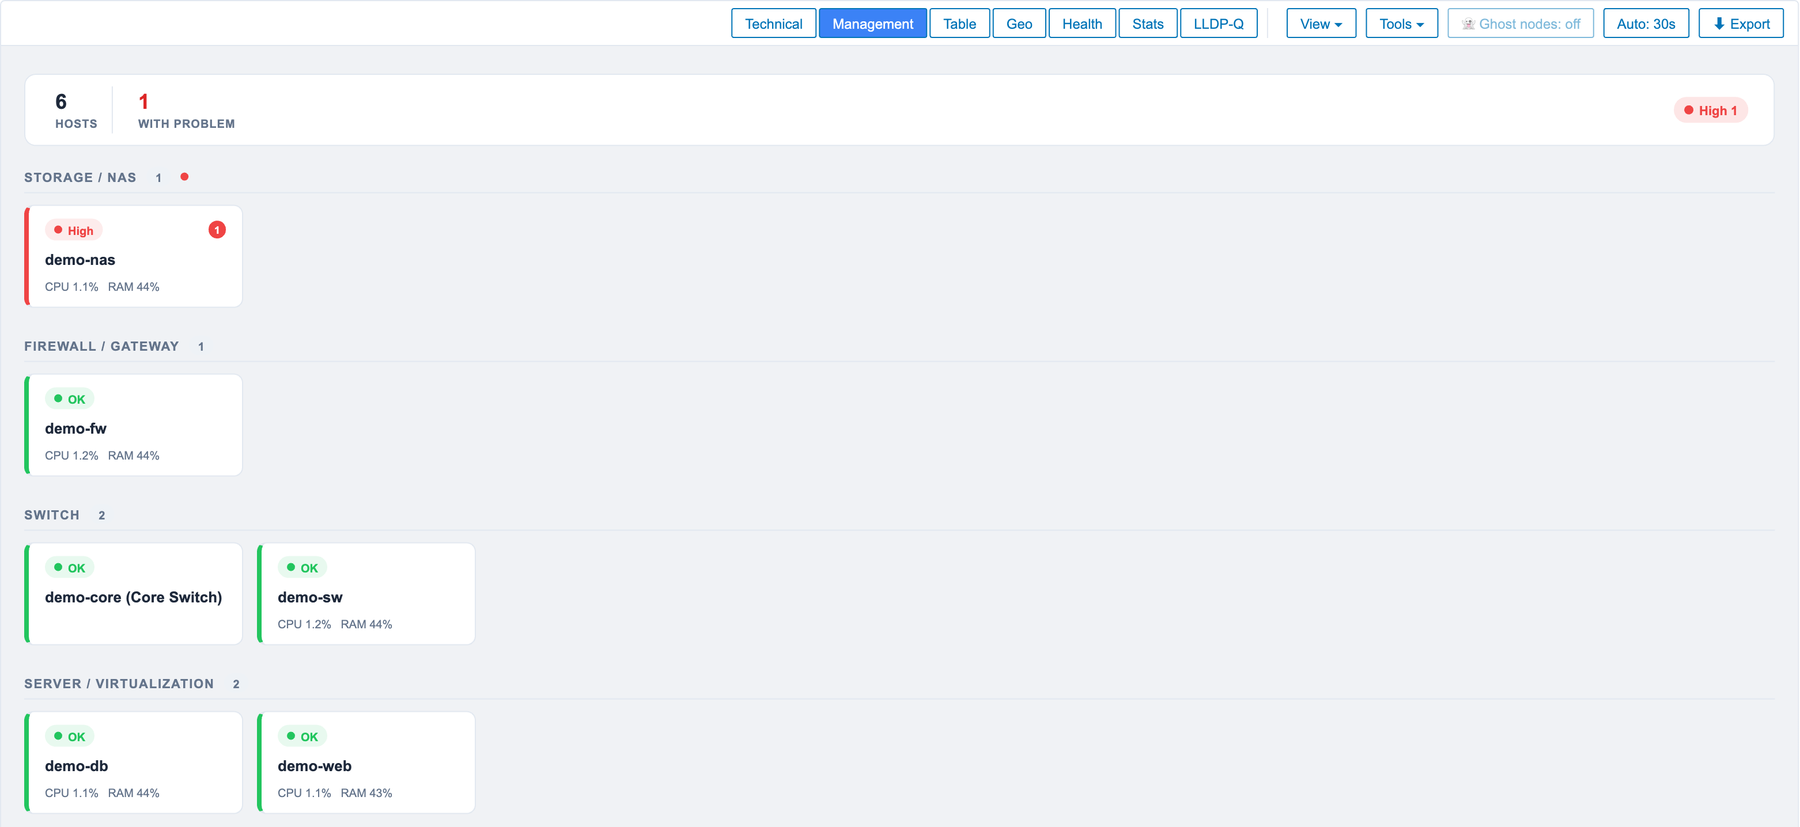
Tiles by device type — firewall, switch, server, storage. For the NOC screen.
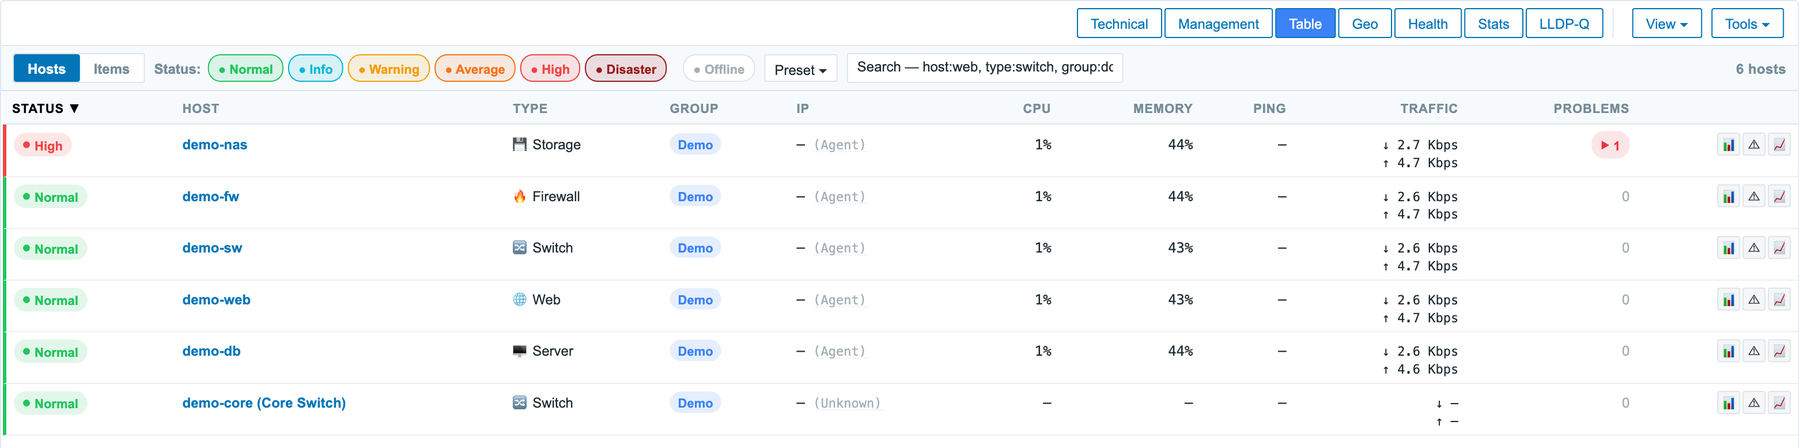
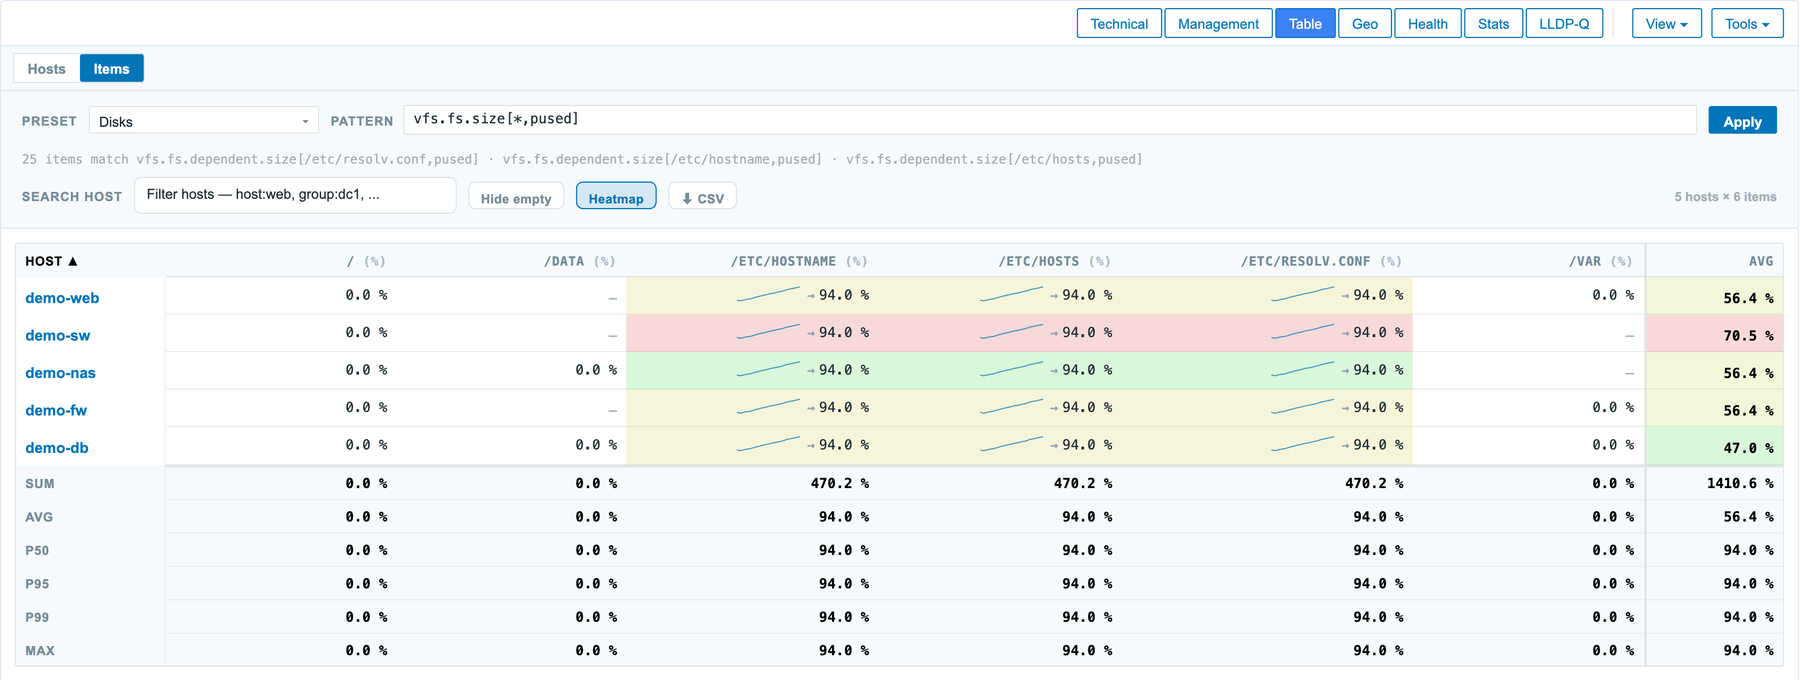
Nagios-style host list or pivot: hosts × items, e.g. every disk in a group.
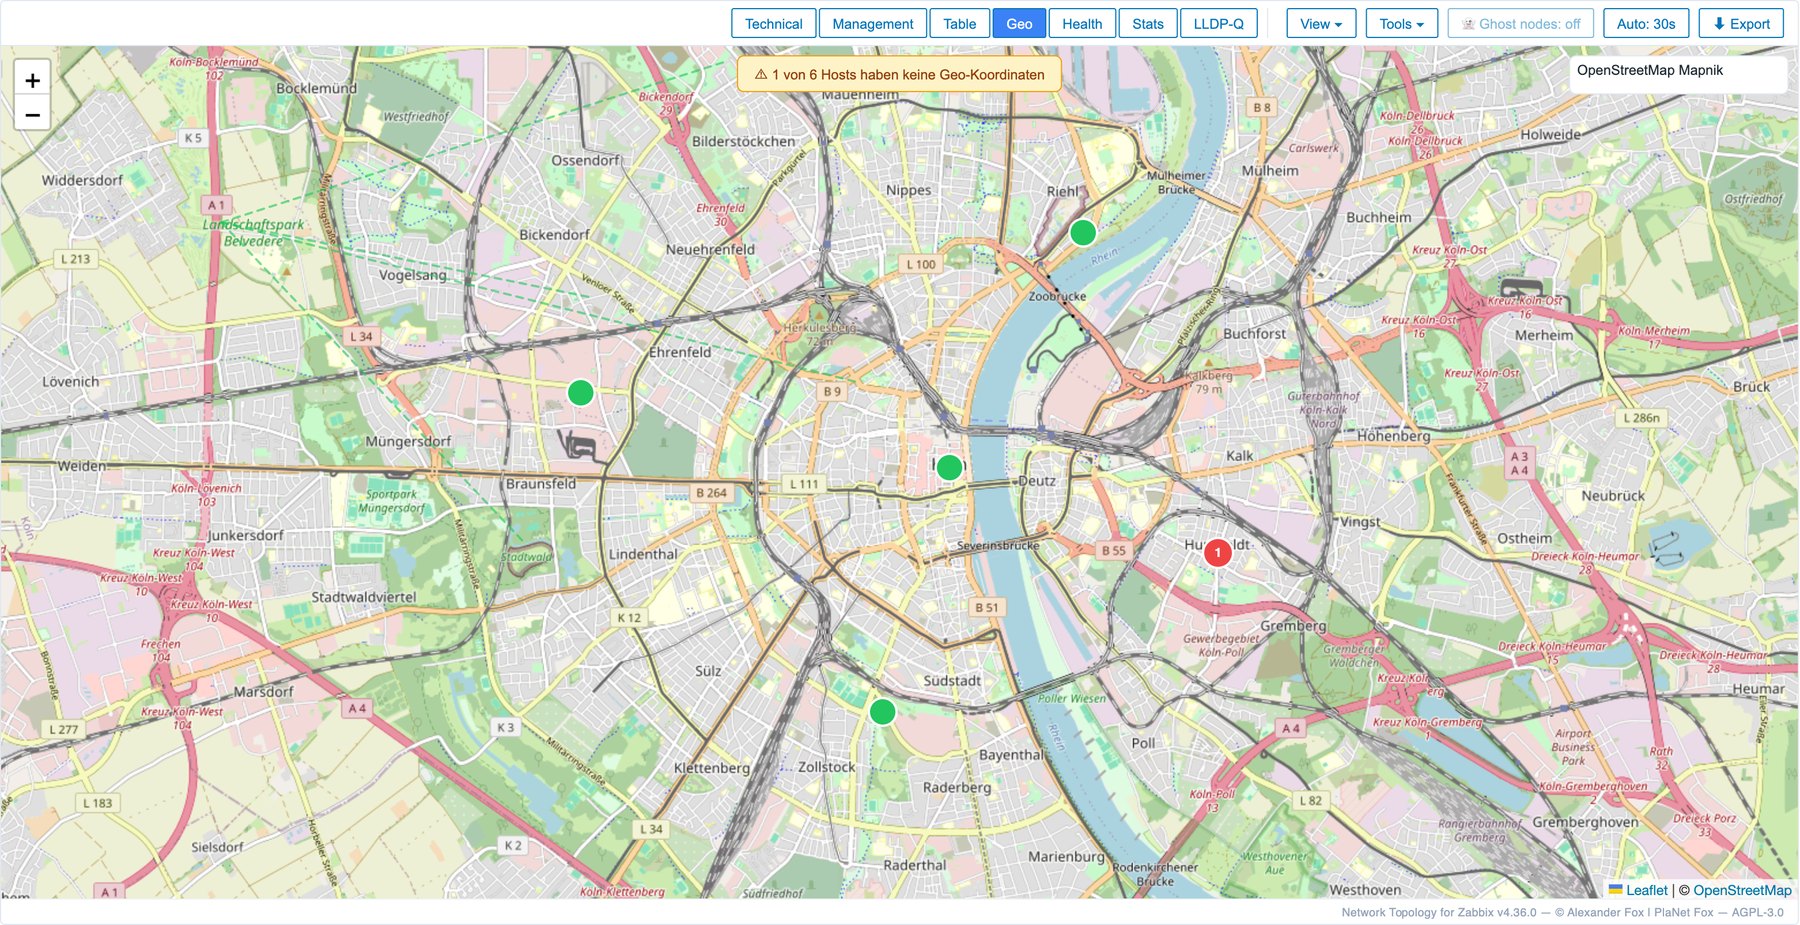
Locations on the map, GPS from the host inventory. For distributed infrastructure.
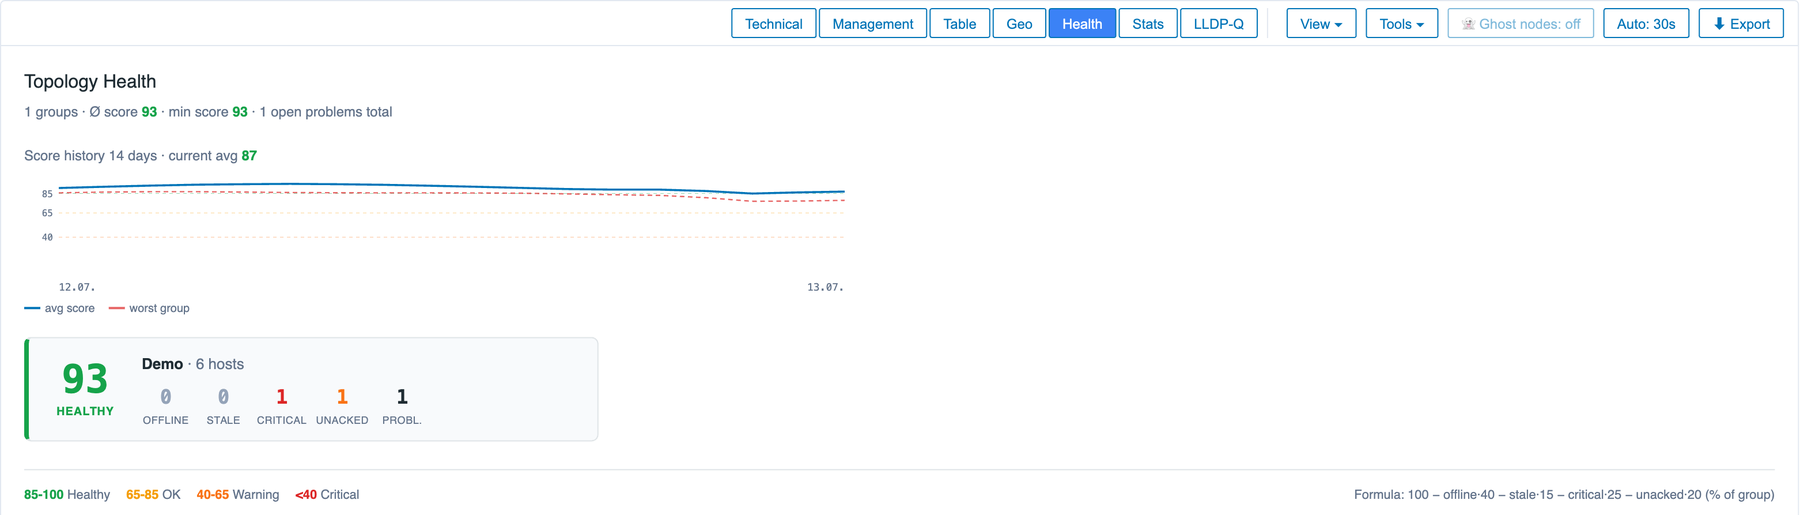
Seven screenshots from the public demo (demo.zabfox.de) — the same data, four views plus health score, geo map and item pivot. Click for full size.
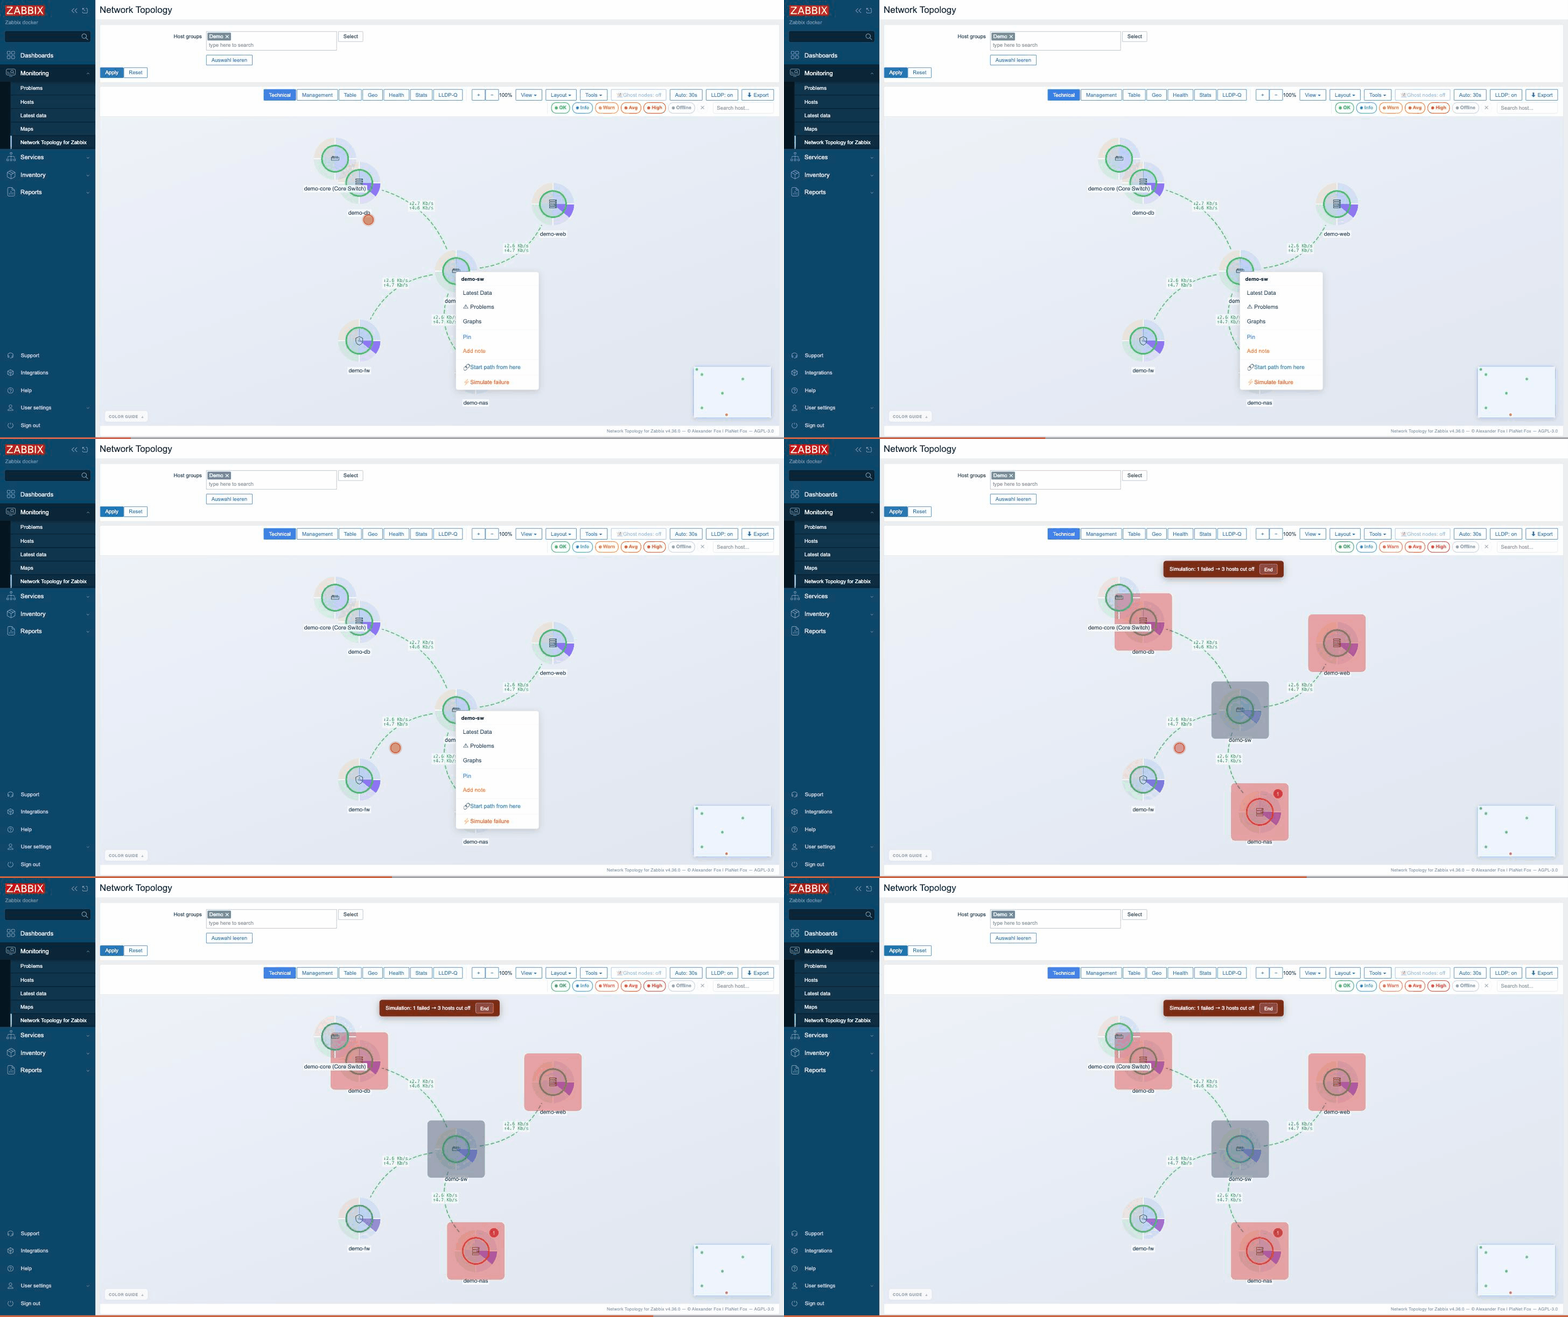
A disaster trigger turns the ring red and pulses. The what-if simulation shows root cause and blast radius — before the first tickets come in.
No build tools, no extra server. Unzip, scan directory, enable.
$ sudo unzip ~/Downloads/network_topology_v6.zip
$ sudo chown -R root:root network_topology_v6
$ sudo systemctl reload php8.3-fpm
# Administration → General → Modules → Scan directory → enable
network_topology_v6 in ui/modules/.ZabFox starts focused — no forest of “coming soon”. What’s done is up front; the roadmap is labelled honestly.